前言
本篇記錄以 docker-compose 方式建立 prometheus、node-exporter 服務
node-exporter 用以蒐集伺服器資訊,並透過 API 提供 Metric 資訊
prometheus 則可透過 node-exporter 蒐集的 Metric 資訊,將資訊整合起來當作資料來源
建立資料夾、yml檔
預期的資料夾配置如下
prometheus-docker-compose.yml
prometheus/
├── config
│ └── prometheus.yml
└── data
建立 prometheus-docker-compose.yml
vi prometheus-docker-compose.yml
version: '3.8'

networks:
  monitoring:
    driver: bridge

volumes:
  prometheus_data: {}

services:
  node-exporter:
    image: prom/node-exporter:latest
    container_name: node-exporter
    restart: unless-stopped
    volumes:
      - /proc:/host/proc:ro
      - /sys:/host/sys:ro
      - /:/rootfs:ro
    command:
      - '--path.procfs=/host/proc'
      - '--path.rootfs=/rootfs'
      - '--path.sysfs=/host/sys'
      - '--collector.filesystem.mount-points-exclude=^/(sys|proc|dev|host|etc)($$|/)'
    ports:
      - 9100:9100
    networks:
      - monitoring

  prometheus:
    image: prom/prometheus:latest
    container_name: prometheus
    restart: unless-stopped
    volumes:
      - ./prometheus/config:/etc/prometheus
      - ./prometheus/data:/prometheus
    command:
      - '--config.file=/etc/prometheus/prometheus.yml'
      - '--storage.tsdb.path=/prometheus'
      - '--web.console.libraries=/etc/prometheus/console_libraries'
      - '--web.console.templates=/etc/prometheus/consoles'
      - '--web.enable-lifecycle'
    ports:
      - 9090:9090
    networks:
      - monitoring
建立資料夾
mkdir prometheus
mkdir prometheus/config
mkdir prometheus/data

# 權限設定
chown -R nobody:nogroup prometheus/data
建立 prometheus/config/prometheus.yml
vi prometheus/config/prometheus.yml
global:
  scrape_interval: 15s # Set the scrape interval to every 15 seconds. Default is every 1 minute.
  evaluation_interval: 15s # Evaluate rules every 15 seconds. The default is every 1 minute.
  # scrape_timeout is set to the global default (10s).

# Alertmanager configuration
alerting:
  alertmanagers:
    - static_configs:
        - targets:
          # - alertmanager:9093

# Load rules once and periodically evaluate them according to the global 'evaluation_interval'.
rule_files:
  # - "first_rules.yml"
  # - "second_rules.yml"

# A scrape configuration containing exactly one endpoint to scrape:
# Here it's Prometheus itself.
scrape_configs:
  # The job name is added as a label `job=<job_name>` to any timeseries scraped from this config.
  - job_name: "prometheus"

    # metrics_path defaults to '/metrics'
    # scheme defaults to 'http'.

    static_configs:
      - targets: ["localhost:9090"]

  # The job name is added as a label `job=<job_name>` to any timeseries scraped from this config.
  - job_name: "node"

    # metrics_path defaults to '/metrics'
    # scheme defaults to 'http'.

    static_configs:
      - targets: ["node-exporter:9100"]
建立完成後 Run docker-compose
docker-compose -f prometheus-docker-compose.yml up -d
查看一下是否建立成功
docker-compose -f prometheus-docker-compose.yml ps

# 輸出
    Name                   Command               State                    Ports
-------------------------------------------------------------------------------------------------
node-exporter   /bin/node_exporter --path. ...   Up      0.0.0.0:9100->9100/tcp,:::9100->9100/tcp
prometheus      /bin/prometheus --config.f ...   Up      0.0.0.0:9090->9090/tcp,:::9090->9090/tcp
查看一下 node-export 的 Metrics API 是否正常
curl http://localhost:9100/metrics

# 輸出
# HELP go_gc_duration_seconds A summary of the pause duration of garbage collection cycles.
# TYPE go_gc_duration_seconds summary
go_gc_duration_seconds{quantile="0"} 5.4387e-05
go_gc_duration_seconds{quantile="0.25"} 9.7283e-05
go_gc_duration_seconds{quantile="0.5"} 0.000119694
go_gc_duration_seconds{quantile="0.75"} 0.000192691
go_gc_duration_seconds{quantile="1"} 0.000771569
go_gc_duration_seconds_sum 0.003983712
go_gc_duration_seconds_count 23
... 太多資料省略 ...
查看一下 prometheus UI 確認 target 狀態
http://$IP:9090/targets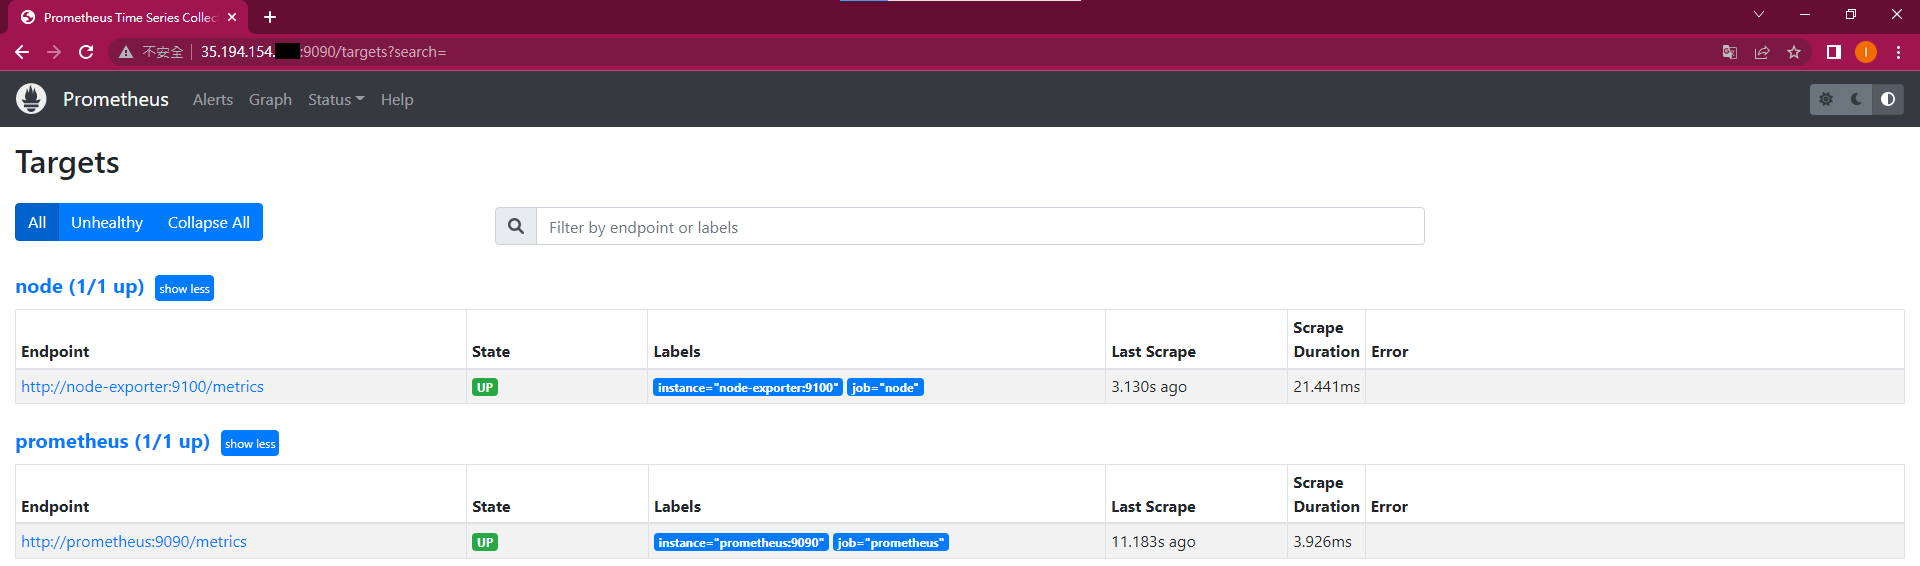
轉載請註明來源,若有任何錯誤或表達不清楚的地方,歡迎在下方評論區留言,也可以來信至 leozheng0621@gmail.com
如果文章對您有幫助,歡迎斗內(donate),請我喝杯咖啡

