前言
本篇記錄如何應用 Telegraf
紀錄學習 HiSKIO 課程 Prometheus + Grafana 監控和警報系統 從入門到進階
介紹
Telegraf 是用 GO 開發的一個開源專案,主要功能用來協助收集統計資料的一個中繼程式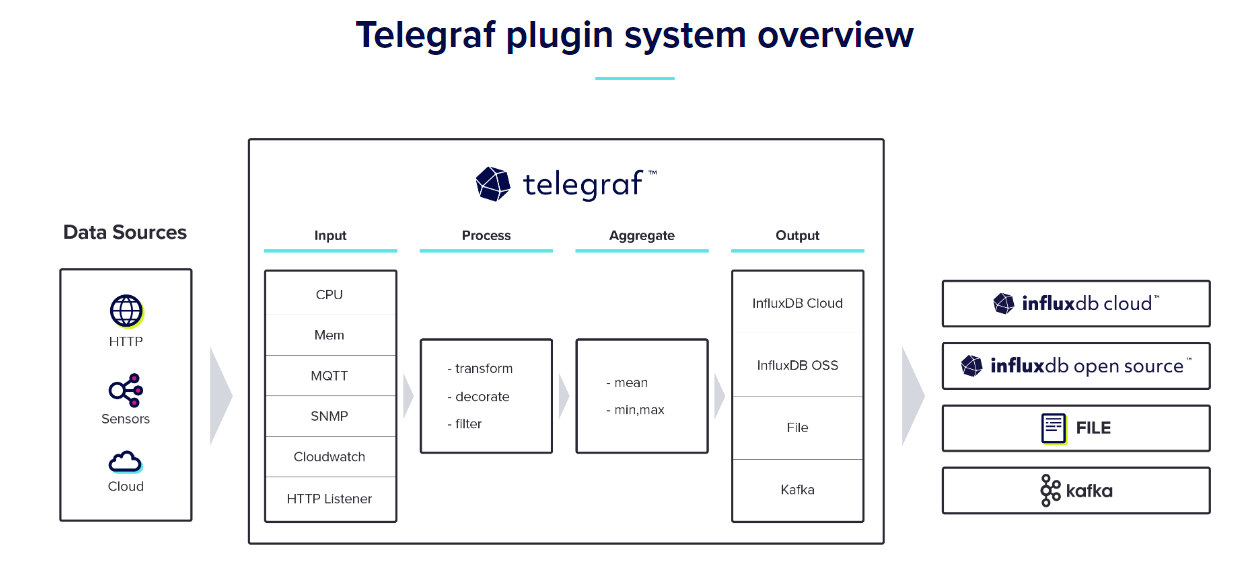
GitHub 上有大量的Telegraf Plugins 可供使用
資料流程為
- Input = 資料來源,Telegraf 可以自己起一個監聽服務讓外界呼叫來協助轉拋資料,也可以主動去拉取其他服務的資料回來
- Process = 取得資料後,可對資料進一步處理或者過濾
- Aggregate = 接著可透過資料建立客製化的 metrics
- Output = 輸出 metrics 資料,可讓其他數據庫服務來取得,或者推送到其他資料庫
作業環境
Windows 10 Professional (22H2)
Docker Desktop
Docker Compose
設定說明
課程範例原始碼資料夾樹狀結構如下
.
├── docker-compose.yml
├── telegraf/
│   ├── telegraf.d
│   │   ├── amazon.conf
│   │   └── github.conf
│   └── telegraf.conf
├── prometheus/
│   └── prometheus.yml
docker-compose.yml
version: "3.0"

services:
  telegraf:
    image: telegraf:1.16.0
    restart: always
    container_name: telegraf
    hostname: telegraf
    ports:
      - 9273:9273
    volumes:
      - ./telegraf/telegraf.conf:/etc/telegraf/telegraf.conf
    command: telegraf --config /etc/telegraf/telegraf.conf
telegraf.conf
[agent]
# https://docs.influxdata.com/telegraf/v1.16/administration/configuration/#agent-configuration
interval = "30s"
flush_interval = "10s"

[[inputs.ping]]
# https://github.com/influxdata/telegraf/blob/master/plugins/inputs/ping/README.md
urls = ["github.com", "amazon.com"]
method = "exec"
count = 3

[[outputs.prometheus_client]]
# https://github.com/influxdata/telegraf/blob/master/plugins/outputs/prometheus_client/README.md
## Address to listen on.
listen = ":9273"
metric_version = 2
配置 telegraf 設定檔,至少需要這三部分 agent、inputs 的 plugins、output 的 plugins
agent
interval= 每隔多長時間蒐集一次資料flush_interval= 每隔多長時間將彙整的資料更新到 output
input.ping = input 的一種 plugin,用來 ping 確認其他服務是否有異常
urls= 要 ping 的目標 domainmethod= 參數方法 (exec (透過主機系統原生的 ping 來呼叫) or native (plugin 直接呼叫))count= 發送次數,若 ping_interval = 1,則代表 1 秒呼叫 3 次
outputs.prometheus_client = output 的一種 plugin,prometheus
listen= 會在本機建立被動的 Port 號,等待 prometheus 來取得metric_version= metric 版本
操作流程
docker-compose up -d

# 確認一下服務
docker-compose ps

# 輸出
NAME                IMAGE               COMMAND                  SERVICE             CREATED             STATUS              PORTS
telegraf            telegraf:1.16.0     "/entrypoint.sh tele…"   telegraf            About an hour ago   Up About an hour    8092/udp, 8125/udp, 8094/tcp, 0.0.0.0:9273->9273/tcp
查看 metrics,開啟 http://localhost:9273/metrics
可以發現蒐集到的 metrics 資料,ex: 平均反應時間
ping_average_response_ms{host="telegraf",url="amazon.com"} 192.085
ping_average_response_ms{host="telegraf",url="github.com"} 56.701
ping_average_response_ms = metrics 名稱
{host=”telegraf”,url=”amazon.com”} = Label,這邊有 host、url 兩個 Label
192.085 = 數值
新增 cpu input plugin
github - telegraf plugins input.cpu
修改 telegraf.conf
[agent]
# https://docs.influxdata.com/telegraf/v1.16/administration/configuration/#agent-configuration
interval = "30s"
flush_interval = "10s"

[[inputs.ping]]
# https://github.com/influxdata/telegraf/blob/master/plugins/inputs/ping/README.md
urls = ["github.com", "amazon.com"]
method = "exec"
count = 3

+[[inputs.cpu]]
+## Whether to report per-cpu stats or not
+percpu = true
+## Whether to report total system cpu stats or not
+totalcpu = true
+## If true, collect raw CPU time metrics
+collect_cpu_time = false
+## If true, compute and report the sum of all non-idle CPU states
+report_active = false
+## If true and the info is available then add core_id and physical_id tags
+core_tags = false

[[outputs.prometheus_client]]
# https://github.com/influxdata/telegraf/blob/master/plugins/outputs/prometheus_client/README.md
## Address to listen on.
listen = ":9273"
metric_version = 2
重啟 docker-compose 服務
docker compose restart
即可看到 除了 ping 的 metrics 也已經有 cpu 的 metrics 了
# TYPE cpu_usage_guest gauge
cpu_usage_guest{cpu="cpu-total",host="telegraf"} 0
cpu_usage_guest{cpu="cpu0",host="telegraf"} 0
添加全局 Lable
修改 telegraf.conf
[agent]
# https://docs.influxdata.com/telegraf/v1.16/administration/configuration/#agent-configuration
interval = "30s"
flush_interval = "10s"

+[global_tags]
+environment = "LeoTest"

[[inputs.ping]]
# https://github.com/influxdata/telegraf/blob/master/plugins/inputs/ping/README.md
urls = ["github.com", "amazon.com"]
method = "exec"
count = 3

[[inputs.cpu]]
## Whether to report per-cpu stats or not
percpu = true
## Whether to report total system cpu stats or not
totalcpu = true
## If true, collect raw CPU time metrics
collect_cpu_time = false
## If true, compute and report the sum of all non-idle CPU states
report_active = false
## If true and the info is available then add core_id and physical_id tags
core_tags = false

[[outputs.prometheus_client]]
# https://github.com/influxdata/telegraf/blob/master/plugins/outputs/prometheus_client/README.md
## Address to listen on.
listen = ":9273"
metric_version = 2
重啟 docker-compose 服務,再次查看 metrics
可以看到已經添加了 全局 environment 的 Labelping_average_response_ms{environment="LeoTest",host="telegraf",url="amazon.com"} 191.99 ping_average_response_ms{environment="LeoTest",host="telegraf",url="github.com"} 54.649
針對特定 input plugin 添加靜態標籤
修改 telegraf.conf
[agent]
# https://docs.influxdata.com/telegraf/v1.16/administration/configuration/#agent-configuration
interval = "30s"
flush_interval = "10s"

[global_tags]
environment = "LeoTest"

[[inputs.ping]]
# https://github.com/influxdata/telegraf/blob/master/plugins/inputs/ping/README.md
urls = ["github.com", "amazon.com"]
method = "exec"
count = 3

+[inputs.ping.tags]
+pingVersion = '1'

[[inputs.cpu]]
## Whether to report per-cpu stats or not
percpu = true
## Whether to report total system cpu stats or not
totalcpu = true
## If true, collect raw CPU time metrics
collect_cpu_time = false
## If true, compute and report the sum of all non-idle CPU states
report_active = false
## If true and the info is available then add core_id and physical_id tags
core_tags = false

+[inputs.cpu.tags]
+cpuVersion = '2'

[[outputs.prometheus_client]]
# https://github.com/influxdata/telegraf/blob/master/plugins/outputs/prometheus_client/README.md
## Address to listen on.
listen = ":9273"
metric_version = 2
重啟 docker-compose 服務,再次查看 metrics
可以看到已經添加了 pingVersion、cpuVersion 的 Labelping_average_response_ms{environment="LeoTest",host="telegraf",pingVersion="1",url="amazon.com"} 192.008 ping_average_response_ms{environment="LeoTest",host="telegraf",pingVersion="1",url="github.com"} 56.853 cpu_usage_guest{cpu="cpu-total",cpuVersion="2",environment="LeoTest",host="telegraf"} 0 cpu_usage_guest{cpu="cpu0",cpuVersion="2",environment="LeoTest",host="telegraf"} 0
添加動態標籤
使用 Telegraf Processor
透過使用 Processor Regex Plugin 來做範例
透過 Regex 解析 url 內容,將 .com 之前的字段建立新的 Lable 來存
ping_average_response_ms{environment=”LeoTest”,host=”telegraf”,url=”amazon.com”} 191.99
修改 telegraf.conf
[agent]
# https://docs.influxdata.com/telegraf/v1.16/administration/configuration/#agent-configuration
interval = "30s"
flush_interval = "10s"

[global_tags]
environment = "LeoTest"

[[inputs.ping]]
# https://github.com/influxdata/telegraf/blob/master/plugins/inputs/ping/README.md
urls = ["github.com", "amazon.com"]
method = "exec"
count = 3

+[[processors.regex]]
+  namepass = ["ping"] # 只處理 metrics 名稱為 ping 的 metrics
+
+  [[processors.regex.tags]]
+    key = "url"
+    pattern = "^([^.]+).*$"
+    replacement = "${1}"
+    result_key = "service_name"

[inputs.ping.tags]
pingVersion = '1'

[[inputs.cpu]]
## Whether to report per-cpu stats or not
percpu = true
## Whether to report total system cpu stats or not
totalcpu = true
## If true, collect raw CPU time metrics
collect_cpu_time = false
## If true, compute and report the sum of all non-idle CPU states
report_active = false
## If true and the info is available then add core_id and physical_id tags
core_tags = false

[inputs.cpu.tags]
cpuVersion = '2'

[[outputs.prometheus_client]]
# https://github.com/influxdata/telegraf/blob/master/plugins/outputs/prometheus_client/README.md
## Address to listen on.
listen = ":9273"
metric_version = 2
重啟 docker-compose 服務,再次查看 metrics
可以看到已經添加了 pingVersion、cpuVersion 的 Labelping_average_response_ms{environment="LeoTest",host="telegraf",pingVersion="1",url="amazon.com"} 192.008 ping_average_response_ms{environment="LeoTest",host="telegraf",pingVersion="1",url="github.com"} 56.853 cpu_usage_guest{cpu="cpu-total",cpuVersion="2",environment="LeoTest",host="telegraf"} 0 cpu_usage_guest{cpu="cpu0",cpuVersion="2",environment="LeoTest",host="telegraf"} 0
參考文件
HiSKIO 課程 Prometheus + Grafana 監控和警報系統 從入門到進階
Telegraf 官網
Telegraf Github
轉載請註明來源,若有任何錯誤或表達不清楚的地方,歡迎在下方評論區留言,也可以來信至 leozheng0621@gmail.com
如果文章對您有幫助,歡迎斗內(donate),請我喝杯咖啡

