前言
延續上一篇 w4560000 - Telegraf 學習筆記-1
紀錄學習 HiSKIO 課程 Prometheus + Grafana 監控和警報系統 從入門到進階
Telegraf Tag 和 Field 差異
會有 tags、fields 欄位是因為 telegraf 為 influxdata 公司所建立的,influxdata 也有其他數據庫產品 influxdb
telegraf 主要還是對接自家產品數據庫 influxdb 為主,所以 tags 是被列為有範圍限制可當 Index 使用的 Key,fields 欄位的值比較沒有範圍限制就不好拿來當 Index 使用
以 Telegraf Ping Input Plugin 為範例
其 README.md 有詳細列出 tags、fields 欄位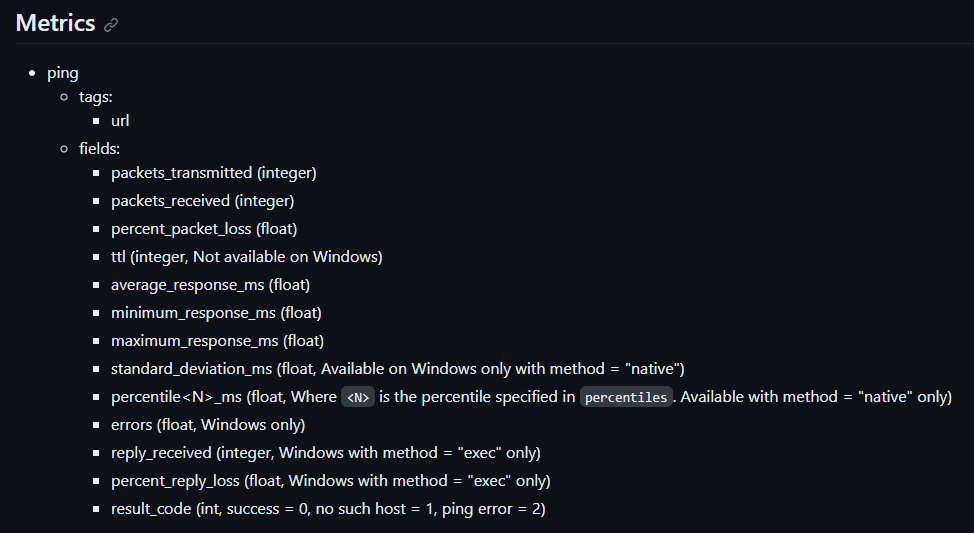
其輸出結果會是
ping,url=example.org average_response_ms=23.066,ttl=63,maximum_response_ms=24.64,minimum_response_ms=22.451,packets_received=5i,packets_transmitted=5i,percent_packet_loss=0,result_code=0i,standard_deviation_ms=0.809 1535747258000000000
而上一篇顯示的 metrics 之所以會顯示
ping_average_response_ms{host="telegraf",url="amazon.com"} 192.085
是因為 output 我們指定為 prometheus 的格式,所以資料有被做進一步處理才導致跟原先輸出格式不同
若之後有 Processor 會需要針對 Tag 和 Field 做不同處理,則要到各個 plugin 頁面上查看會影響到哪些欄位
配置多個相同的 Input Plugin
修改 telegraf.conf
[agent]
# https://docs.influxdata.com/telegraf/v1.16/administration/configuration/#agent-configuration
interval = "30s"
flush_interval = "10s"

[global_tags]
environment = "LeoTest"

+[[inputs.ping]]
+# https://github.com/influxdata/telegraf/blob/master/plugins/inputs/ping/README.md
+urls = ["github.com"]
+method = "exec"
+count = 3
+
+[inputs.ping.tags]
+pingVersion = '1'
+
+[[inputs.ping]]
+# https://github.com/influxdata/telegraf/blob/master/plugins/inputs/ping/README.md
+urls = ["amazon.com"]
+method = "exec"
+count = 5
+
+[inputs.ping.tags]
+pingVersion = '2'

[[processors.regex]]
  namepass = ["ping"] # 只處理 metrics 名稱為 ping 的 metrics

  [[processors.regex.tags]]
    key = "url"
    pattern = "^([^.]+).*$"
    replacement = "${1}"
    result_key = "service_name"

[[inputs.cpu]]
## Whether to report per-cpu stats or not
percpu = true
## Whether to report total system cpu stats or not
totalcpu = true
## If true, collect raw CPU time metrics
collect_cpu_time = false
## If true, compute and report the sum of all non-idle CPU states
report_active = false
## If true and the info is available then add core_id and physical_id tags
core_tags = false

[inputs.cpu.tags]
cpuVersion = '2'

[[outputs.prometheus_client]]
# https://github.com/influxdata/telegraf/blob/master/plugins/outputs/prometheus_client/README.md
## Address to listen on.
listen = ":9273"
metric_version = 2
重啟 docker-compose 服務,再次查看 metrics
可以看到我們可以同時添加同一個 Input Plugin,但可以有不同設定、不同 Tag 數值ping_average_response_ms{environment="LeoTest",host="telegraf",pingVersion="1",service_name="github",url="github.com"} 56.389 ping_average_response_ms{environment="LeoTest",host="telegraf",pingVersion="2",service_name="amazon",url="amazon.com"} 191.542 ping_packets_received{environment="LeoTest",host="telegraf",pingVersion="1",service_name="github",url="github.com"} 3 ping_packets_received{environment="LeoTest",host="telegraf",pingVersion="2",service_name="amazon",url="amazon.com"} 5
透過 telegraf.d 資料夾來對 conf 設定檔做分類
目前資料夾樹狀結構如下
.
├── docker-compose.yml
└── telegraf/
    └── telegraf.conf
預期調整
新增一個 telegraf.d 資料夾,存放 github.conf、amazon.conf
.
├── docker-compose.yml
└── telegraf/
    ├── telegraf.d
    │   ├── amazon.conf
    │   └── github.conf
    └── telegraf.conf
修改 telegraf.conf,移除 inputs.ping
[agent]
# https://docs.influxdata.com/telegraf/v1.16/administration/configuration/#agent-configuration
interval = "30s"
flush_interval = "10s"

[global_tags]
environment = "LeoTest"

-[[inputs.ping]]
-# https://github.com/influxdata/telegraf/blob/master/plugins/inputs/ping/README.md
-urls = ["github.com"]
-method = "exec"
-count = 3
-
-[inputs.ping.tags]
-pingVersion = '1'
-
-[[inputs.ping]]
-# https://github.com/influxdata/telegraf/blob/master/plugins/inputs/ping/README.md
-urls = ["amazon.com"]
-method = "exec"
-count = 5
-
-[inputs.ping.tags]
-pingVersion = '2'

[[processors.regex]]
  namepass = ["ping"] # 只處理 metrics 名稱為 ping 的 metrics

  [[processors.regex.tags]]
    key = "url"
    pattern = "^([^.]+).*$"
    replacement = "${1}"
    result_key = "service_name"

[[inputs.cpu]]
## Whether to report per-cpu stats or not
percpu = true
## Whether to report total system cpu stats or not
totalcpu = true
## If true, collect raw CPU time metrics
collect_cpu_time = false
## If true, compute and report the sum of all non-idle CPU states
report_active = false
## If true and the info is available then add core_id and physical_id tags
core_tags = false

[inputs.cpu.tags]
cpuVersion = '2'

[[outputs.prometheus_client]]
# https://github.com/influxdata/telegraf/blob/master/plugins/outputs/prometheus_client/README.md
## Address to listen on.
listen = ":9273"
metric_version = 2
新增 github.conf
[[inputs.ping]]
# https://github.com/influxdata/telegraf/blob/master/plugins/inputs/ping/README.md
urls = ["github.com"]
method = "exec"
count = 3

[inputs.ping.tags]
pingVersion = '1'
新增 amazon.conf
[[inputs.ping]]
# https://github.com/influxdata/telegraf/blob/master/plugins/inputs/ping/README.md
urls = ["amazon.com"]
method = "exec"
count = 5

[inputs.ping.tags]
pingVersion = '2'
調整 docker-compose.yml
version: "3.0"

services:
  telegraf:
    image: telegraf:1.16.0
    restart: always
    container_name: telegraf
    hostname: telegraf
    ports:
      - 9273:9273
    volumes:
      - ./telegraf/telegraf.conf:/etc/telegraf/telegraf.conf
+     - ./telegraf/telegraf.d/:/etc/telegraf/telegraf.d/
+   command: telegraf --config /etc/telegraf/telegraf.conf --config-directory /etc/telegraf/telegraf.d
重啟 docker compose 做測試
# 暫停服務後先移除
docker compose stop
docker compose rm

# 啟動服務
docker compose up -d
確認功能仍正常
ping_average_response_ms{environment="LeoTest",host="telegraf",pingVersion="1",service_name="github",url="github.com"} 56.184
ping_average_response_ms{environment="LeoTest",host="telegraf",pingVersion="2",service_name="amazon",url="amazon.com"} 191.44
ping_packets_received{environment="LeoTest",host="telegraf",pingVersion="1",service_name="github",url="github.com"} 3
ping_packets_received{environment="LeoTest",host="telegraf",pingVersion="2",service_name="amazon",url="amazon.com"} 5
備註: processors.regex 也可以從 telegraf.conf 抽出來單獨管理
若日後有很多 processors 時這樣比較好維護,不過 processors 是全局設定 跟 input.tags 不同
若 processors.regex 也抽到 github.conf 裡,amazon.conf 一樣也會吃到設定,需注意
參考文件
HiSKIO 課程 Prometheus + Grafana 監控和警報系統 從入門到進階
Telegraf 官網
Telegraf Github
轉載請註明來源,若有任何錯誤或表達不清楚的地方,歡迎在下方評論區留言,也可以來信至 leozheng0621@gmail.com
如果文章對您有幫助,歡迎斗內(donate),請我喝杯咖啡

