前言
本篇記錄由 Prometheus 蒐集 .Net 6 WebAPI 的 Mertics,並在 Garfana 呈現資料
.Net 6 WebAPI 專案設定
.Net 6 專案建立
dotnet new sln --output Prometheus_Test
dotnet new webapi -f net6.0 -o Prometheus_Test/Prometheus_Test
dotnet sln Prometheus_Test/Prometheus_Test.sln add Prometheus_Test/Prometheus_Test/Prometheus_Test.csproj
安裝 Prometheus Nuget 套件
cd Prometheus_Test/Prometheus_Test
dotnet add package prometheus-net.AspNetCore --version 6.0.0
dotnet add package prometheus-net.DotNetRuntime --version 4.2.4
調整 Program.cs
+ using Prometheus;
+ using Prometheus.DotNetRuntime;

  var builder = WebApplication.CreateBuilder(args);

+ DotNetRuntimeStatsBuilder.Default().StartCollecting();

  // Add services to the container.

  builder.Services.AddControllers();
  // Learn more about configuring Swagger/OpenAPI at https://aka.ms/aspnetcore/swashbuckle
  builder.Services.AddEndpointsApiExplorer();
  builder.Services.AddSwaggerGen();

  var app = builder.Build();

  // Configure the HTTP request pipeline.
  if (app.Environment.IsDevelopment())
  {
      app.UseSwagger();
      app.UseSwaggerUI();
  }

  app.UseHttpsRedirection();

  app.UseAuthorization();

  app.MapControllers();

+ // Prometheus 提供服務數據資料源
+ app.MapMetrics();
+ app.UseHttpMetrics();

  app.Run();
設定好後 測試一下 /metrics API 是否正常
http://35.201.232.72:2000/metrics
# HELP process_cpu_count The number of processor cores available to this process.
# TYPE process_cpu_count gauge
process_cpu_count 2
# HELP dotnet_build_info Build information about prometheus-net.DotNetRuntime and the environment
# TYPE dotnet_build_info gauge
dotnet_build_info{version="4.2.4.0",target_framework=".NETCoreApp,Version=v6.0",runtime_version=".NET 6.0.6",os_version="Microsoft Windows 10.0.14393",process_architecture="X64",gc_mode="Server"} 1
# HELP dotnet_threadpool_throughput_total The total number of work items that have finished execution in the thread pool
# TYPE dotnet_threadpool_throughput_total counter
dotnet_threadpool_throughput_total 11
# HELP process_start_time_seconds Start time of the process since unix epoch in seconds.
# TYPE process_start_time_seconds gauge
process_start_time_seconds 1655539148.2208407
# HELP process_private_memory_bytes Process private memory size
# TYPE process_private_memory_bytes gauge
process_private_memory_bytes 45195264
# HELP process_num_threads Total number of threads
# TYPE process_num_threads gauge
process_num_threads 30
# HELP dotnet_gc_heap_size_bytes The current size of all heaps (only updated after a garbage collection)
# TYPE dotnet_gc_heap_size_bytes gauge
dotnet_gc_heap_size_bytes{gc_generation="0"} 0
dotnet_gc_heap_size_bytes{gc_generation="1"} 0
dotnet_gc_heap_size_bytes{gc_generation="loh"} 0
dotnet_gc_heap_size_bytes{gc_generation="2"} 0
# HELP dotnet_gc_pause_ratio The percentage of time the process spent paused for garbage collection
# TYPE dotnet_gc_pause_ratio gauge
dotnet_gc_pause_ratio 0
# HELP dotnet_sockets_connections_established_outgoing_total The total number of outgoing established TCP connections
# TYPE dotnet_sockets_connections_established_outgoing_total counter
dotnet_sockets_connections_established_outgoing_total 0
# HELP process_virtual_memory_bytes Virtual memory size in bytes.
# TYPE process_virtual_memory_bytes gauge
process_virtual_memory_bytes 2209054085120
# HELP dotnet_jit_method_total Total number of methods compiled by the JIT compiler
# TYPE dotnet_jit_method_total counter
dotnet_jit_method_total 1955
# HELP dotnet_collection_count_total GC collection count
# TYPE dotnet_collection_count_total counter
dotnet_collection_count_total{generation="0"} 0
dotnet_collection_count_total{generation="1"} 0
dotnet_collection_count_total{generation="2"} 0
# HELP process_cpu_seconds_total Total user and system CPU time spent in seconds.
# TYPE process_cpu_seconds_total counter
process_cpu_seconds_total 1.328125
# HELP dotnet_jit_il_bytes Total bytes of IL compiled by the JIT compiler
# TYPE dotnet_jit_il_bytes gauge
dotnet_jit_il_bytes 147129
# HELP dotnet_total_memory_bytes Total known allocated memory
# TYPE dotnet_total_memory_bytes gauge
dotnet_total_memory_bytes 3941928
# HELP dotnet_sockets_bytes_sent_total The total number of bytes sent over the network
# TYPE dotnet_sockets_bytes_sent_total counter
dotnet_sockets_bytes_sent_total 0
# HELP dotnet_sockets_bytes_received_total The total number of bytes received over the network
# TYPE dotnet_sockets_bytes_received_total counter
dotnet_sockets_bytes_received_total 0
# HELP dotnet_gc_memory_total_available_bytes The upper limit on the amount of physical memory .NET can allocate to
# TYPE dotnet_gc_memory_total_available_bytes gauge
dotnet_gc_memory_total_available_bytes 8589516800
# HELP dotnet_sockets_connections_established_incoming_total The total number of incoming established TCP connections
# TYPE dotnet_sockets_connections_established_incoming_total counter
dotnet_sockets_connections_established_incoming_total 0
# HELP http_requests_received_total Provides the count of HTTP requests that have been processed by the ASP.NET Core pipeline.
# TYPE http_requests_received_total counter
http_requests_received_total{code="404",method="GET",controller="",action="",endpoint=""} 2
http_requests_received_total{code="200",method="GET",controller="WeatherForecast",action="Get",endpoint="WeatherForecast"} 4
# HELP dotnet_contention_total The number of locks contended
# TYPE dotnet_contention_total counter
dotnet_contention_total 2
# HELP process_working_set_bytes Process working set
# TYPE process_working_set_bytes gauge
process_working_set_bytes 59727872
# HELP dotnet_internal_recycle_count prometheus-net.DotNetRuntime internal metric. Counts the number of times the underlying event listeners have been recycled
# TYPE dotnet_internal_recycle_count counter
dotnet_internal_recycle_count 0
# HELP dotnet_threadpool_num_threads The number of active threads in the thread pool
# TYPE dotnet_threadpool_num_threads gauge
dotnet_threadpool_num_threads 3
# HELP dotnet_threadpool_queue_length Measures the queue length of the thread pool. Values greater than 0 indicate a backlog of work for the threadpool to process.
# TYPE dotnet_threadpool_queue_length histogram
dotnet_threadpool_queue_length_sum 0
dotnet_threadpool_queue_length_count 29
dotnet_threadpool_queue_length_bucket{le="0"} 29
dotnet_threadpool_queue_length_bucket{le="1"} 29
dotnet_threadpool_queue_length_bucket{le="10"} 29
dotnet_threadpool_queue_length_bucket{le="100"} 29
dotnet_threadpool_queue_length_bucket{le="1000"} 29
dotnet_threadpool_queue_length_bucket{le="+Inf"} 29
# HELP http_request_duration_seconds The duration of HTTP requests processed by an ASP.NET Core application.
# TYPE http_request_duration_seconds histogram
http_request_duration_seconds_sum{code="404",method="GET",controller="",action="",endpoint=""} 0.0062585
http_request_duration_seconds_count{code="404",method="GET",controller="",action="",endpoint=""} 2
http_request_duration_seconds_bucket{code="404",method="GET",controller="",action="",endpoint="",le="0.001"} 1
http_request_duration_seconds_bucket{code="404",method="GET",controller="",action="",endpoint="",le="0.002"} 1
http_request_duration_seconds_bucket{code="404",method="GET",controller="",action="",endpoint="",le="0.004"} 1
http_request_duration_seconds_bucket{code="404",method="GET",controller="",action="",endpoint="",le="0.008"} 2
http_request_duration_seconds_bucket{code="404",method="GET",controller="",action="",endpoint="",le="0.016"} 2
http_request_duration_seconds_bucket{code="404",method="GET",controller="",action="",endpoint="",le="0.032"} 2
http_request_duration_seconds_bucket{code="404",method="GET",controller="",action="",endpoint="",le="0.064"} 2
http_request_duration_seconds_bucket{code="404",method="GET",controller="",action="",endpoint="",le="0.128"} 2
http_request_duration_seconds_bucket{code="404",method="GET",controller="",action="",endpoint="",le="0.256"} 2
http_request_duration_seconds_bucket{code="404",method="GET",controller="",action="",endpoint="",le="0.512"} 2
http_request_duration_seconds_bucket{code="404",method="GET",controller="",action="",endpoint="",le="1.024"} 2
http_request_duration_seconds_bucket{code="404",method="GET",controller="",action="",endpoint="",le="2.048"} 2
http_request_duration_seconds_bucket{code="404",method="GET",controller="",action="",endpoint="",le="4.096"} 2
http_request_duration_seconds_bucket{code="404",method="GET",controller="",action="",endpoint="",le="8.192"} 2
http_request_duration_seconds_bucket{code="404",method="GET",controller="",action="",endpoint="",le="16.384"} 2
http_request_duration_seconds_bucket{code="404",method="GET",controller="",action="",endpoint="",le="32.768"} 2
http_request_duration_seconds_bucket{code="404",method="GET",controller="",action="",endpoint="",le="+Inf"} 2
http_request_duration_seconds_sum{code="200",method="GET",controller="WeatherForecast",action="Get",endpoint="WeatherForecast"} 0.0930558
http_request_duration_seconds_count{code="200",method="GET",controller="WeatherForecast",action="Get",endpoint="WeatherForecast"} 4
http_request_duration_seconds_bucket{code="200",method="GET",controller="WeatherForecast",action="Get",endpoint="WeatherForecast",le="0.001"} 2
http_request_duration_seconds_bucket{code="200",method="GET",controller="WeatherForecast",action="Get",endpoint="WeatherForecast",le="0.002"} 3
http_request_duration_seconds_bucket{code="200",method="GET",controller="WeatherForecast",action="Get",endpoint="WeatherForecast",le="0.004"} 3
http_request_duration_seconds_bucket{code="200",method="GET",controller="WeatherForecast",action="Get",endpoint="WeatherForecast",le="0.008"} 3
http_request_duration_seconds_bucket{code="200",method="GET",controller="WeatherForecast",action="Get",endpoint="WeatherForecast",le="0.016"} 3
http_request_duration_seconds_bucket{code="200",method="GET",controller="WeatherForecast",action="Get",endpoint="WeatherForecast",le="0.032"} 3
http_request_duration_seconds_bucket{code="200",method="GET",controller="WeatherForecast",action="Get",endpoint="WeatherForecast",le="0.064"} 3
http_request_duration_seconds_bucket{code="200",method="GET",controller="WeatherForecast",action="Get",endpoint="WeatherForecast",le="0.128"} 4
http_request_duration_seconds_bucket{code="200",method="GET",controller="WeatherForecast",action="Get",endpoint="WeatherForecast",le="0.256"} 4
http_request_duration_seconds_bucket{code="200",method="GET",controller="WeatherForecast",action="Get",endpoint="WeatherForecast",le="0.512"} 4
http_request_duration_seconds_bucket{code="200",method="GET",controller="WeatherForecast",action="Get",endpoint="WeatherForecast",le="1.024"} 4
http_request_duration_seconds_bucket{code="200",method="GET",controller="WeatherForecast",action="Get",endpoint="WeatherForecast",le="2.048"} 4
http_request_duration_seconds_bucket{code="200",method="GET",controller="WeatherForecast",action="Get",endpoint="WeatherForecast",le="4.096"} 4
http_request_duration_seconds_bucket{code="200",method="GET",controller="WeatherForecast",action="Get",endpoint="WeatherForecast",le="8.192"} 4
http_request_duration_seconds_bucket{code="200",method="GET",controller="WeatherForecast",action="Get",endpoint="WeatherForecast",le="16.384"} 4
http_request_duration_seconds_bucket{code="200",method="GET",controller="WeatherForecast",action="Get",endpoint="WeatherForecast",le="32.768"} 4
http_request_duration_seconds_bucket{code="200",method="GET",controller="WeatherForecast",action="Get",endpoint="WeatherForecast",le="+Inf"} 4
# HELP dotnet_threadpool_timer_count The number of timers active
# TYPE dotnet_threadpool_timer_count gauge
dotnet_threadpool_timer_count 1
# HELP dotnet_exceptions_total Count of exceptions thrown
# TYPE dotnet_exceptions_total counter
dotnet_exceptions_total 0
# HELP http_requests_in_progress The number of requests currently in progress in the ASP.NET Core pipeline. One series without controller/action label values counts all in-progress requests, with separate series existing for each controller-action pair.
# TYPE http_requests_in_progress gauge
http_requests_in_progress{method="GET",controller="WeatherForecast",action="Get",endpoint="WeatherForecast"} 0
http_requests_in_progress{method="GET",controller="",action="",endpoint=""} 0
# HELP dotnet_gc_collection_count_total Counts the number of garbage collections that have occurred, broken down by generation number.
# TYPE dotnet_gc_collection_count_total counter
dotnet_gc_collection_count_total{gc_generation="0"} 0
dotnet_gc_collection_count_total{gc_generation="1"} 0
dotnet_gc_collection_count_total{gc_generation="2"} 0
# HELP dotnet_gc_allocated_bytes_total The total number of bytes allocated on the managed heap
# TYPE dotnet_gc_allocated_bytes_total counter
dotnet_gc_allocated_bytes_total 3100248
# HELP process_open_handles Number of open handles
# TYPE process_open_handles gauge
process_open_handles 495
調整 Prometheus.yml
prometheus.yml 可參考此篇 w4560000 - 透過 Docker Compose 建立 Prometheus、Node-Exporter
在 scrape_configs 底下 多新增 job 蒐集 .NetCore Metrics
...略
  # The job name is added as a label `job=<job_name>` to any timeseries scraped from this config.
  - job_name: ".netcore"

    # metrics_path defaults to '/metrics'
    # scheme defaults to 'http'.

    static_configs:
      - targets: ["35.201.232.72:2000"]
調整完後 熱更新 prometheus 服務
當有啟用 web.enable-lifecycle 時,修改了 prometheus.yml 之後,可直接熱更新不需重啟服務
curl -X POST http://127.0.0.1:9090/-/reload
查看 prometheus ui 確認是否正確蒐集到 .NetCore 的 Metrics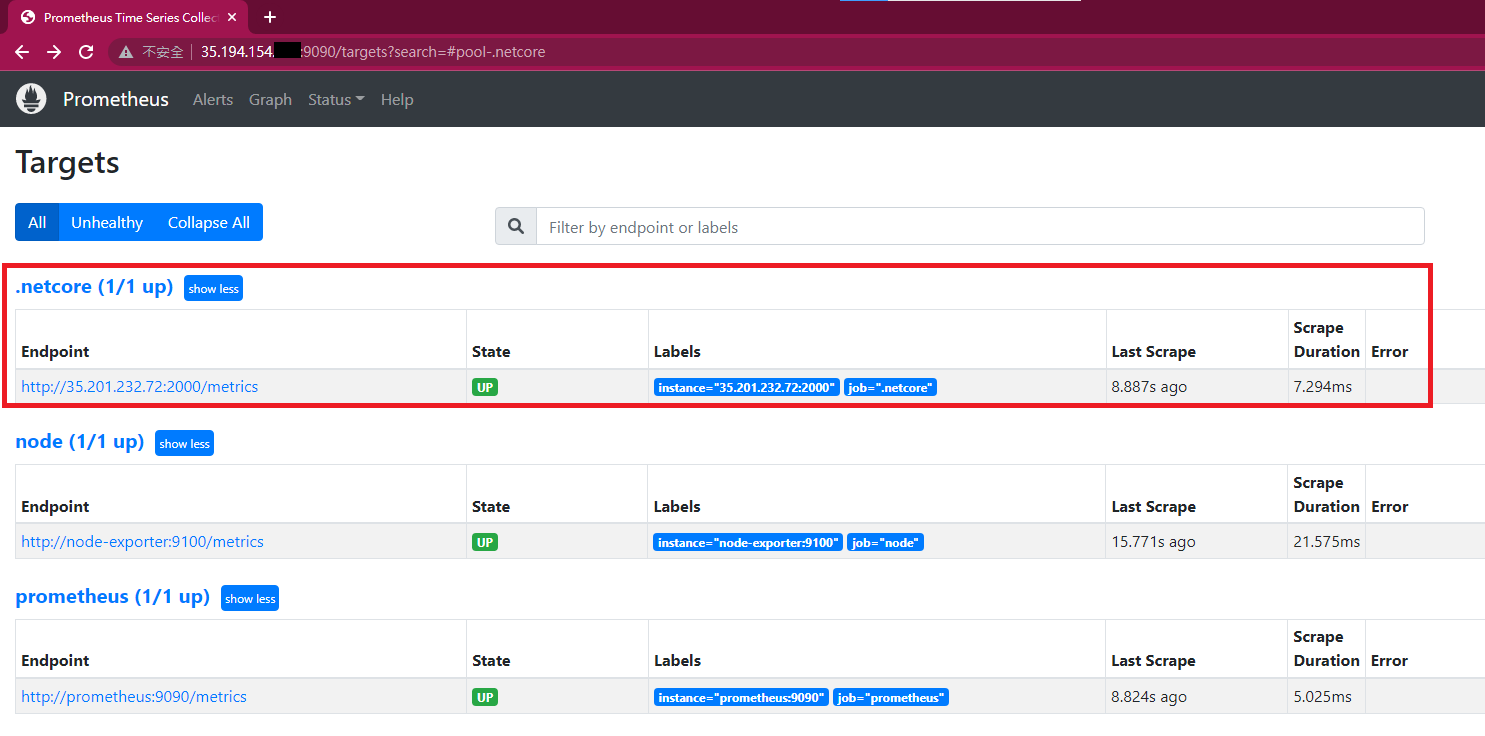
設定 Garfana
新增 Data Source Prometheus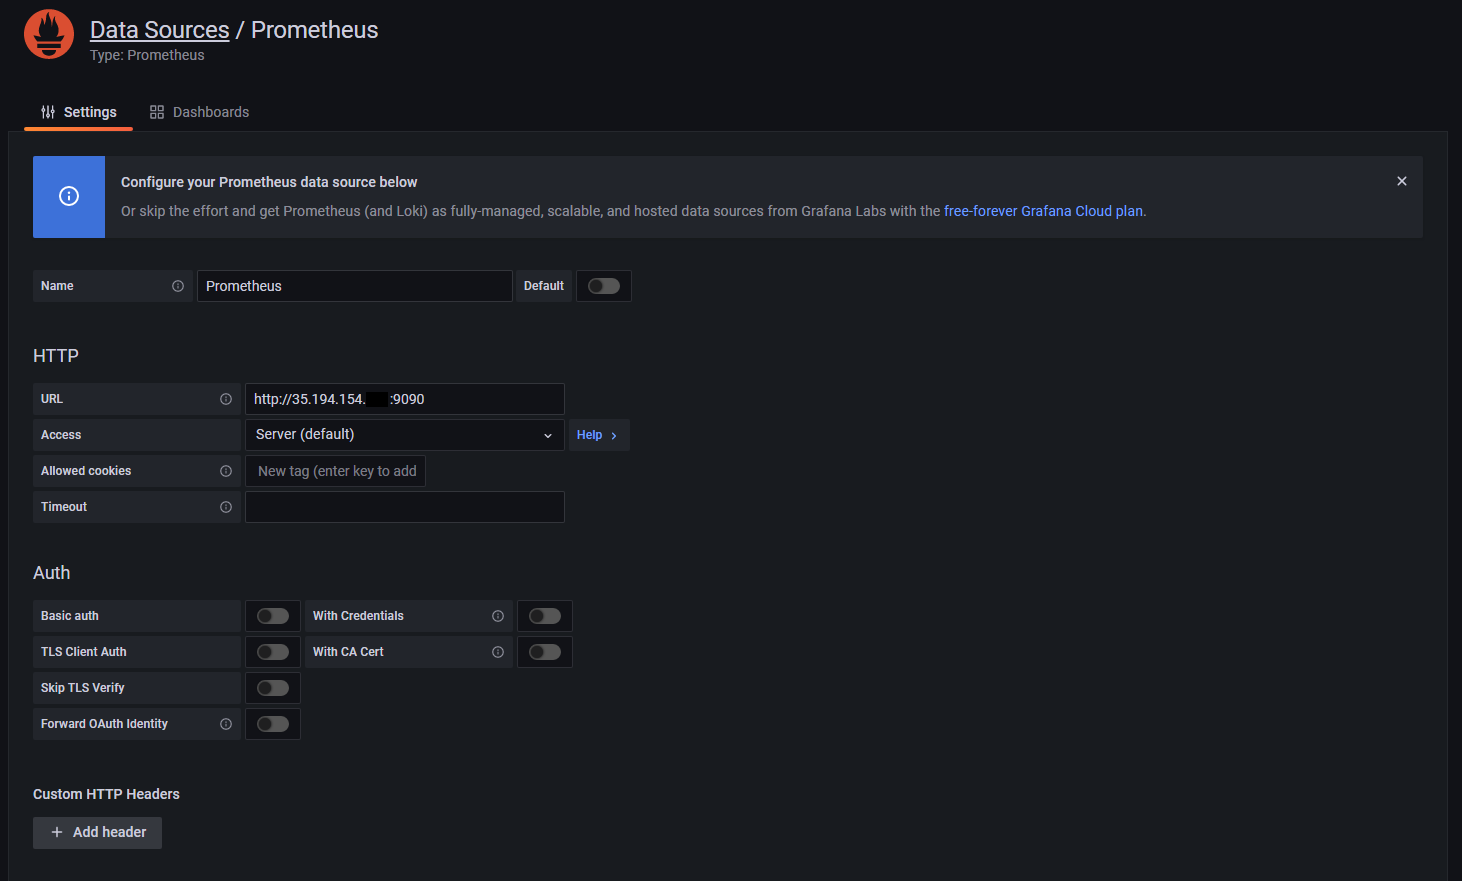
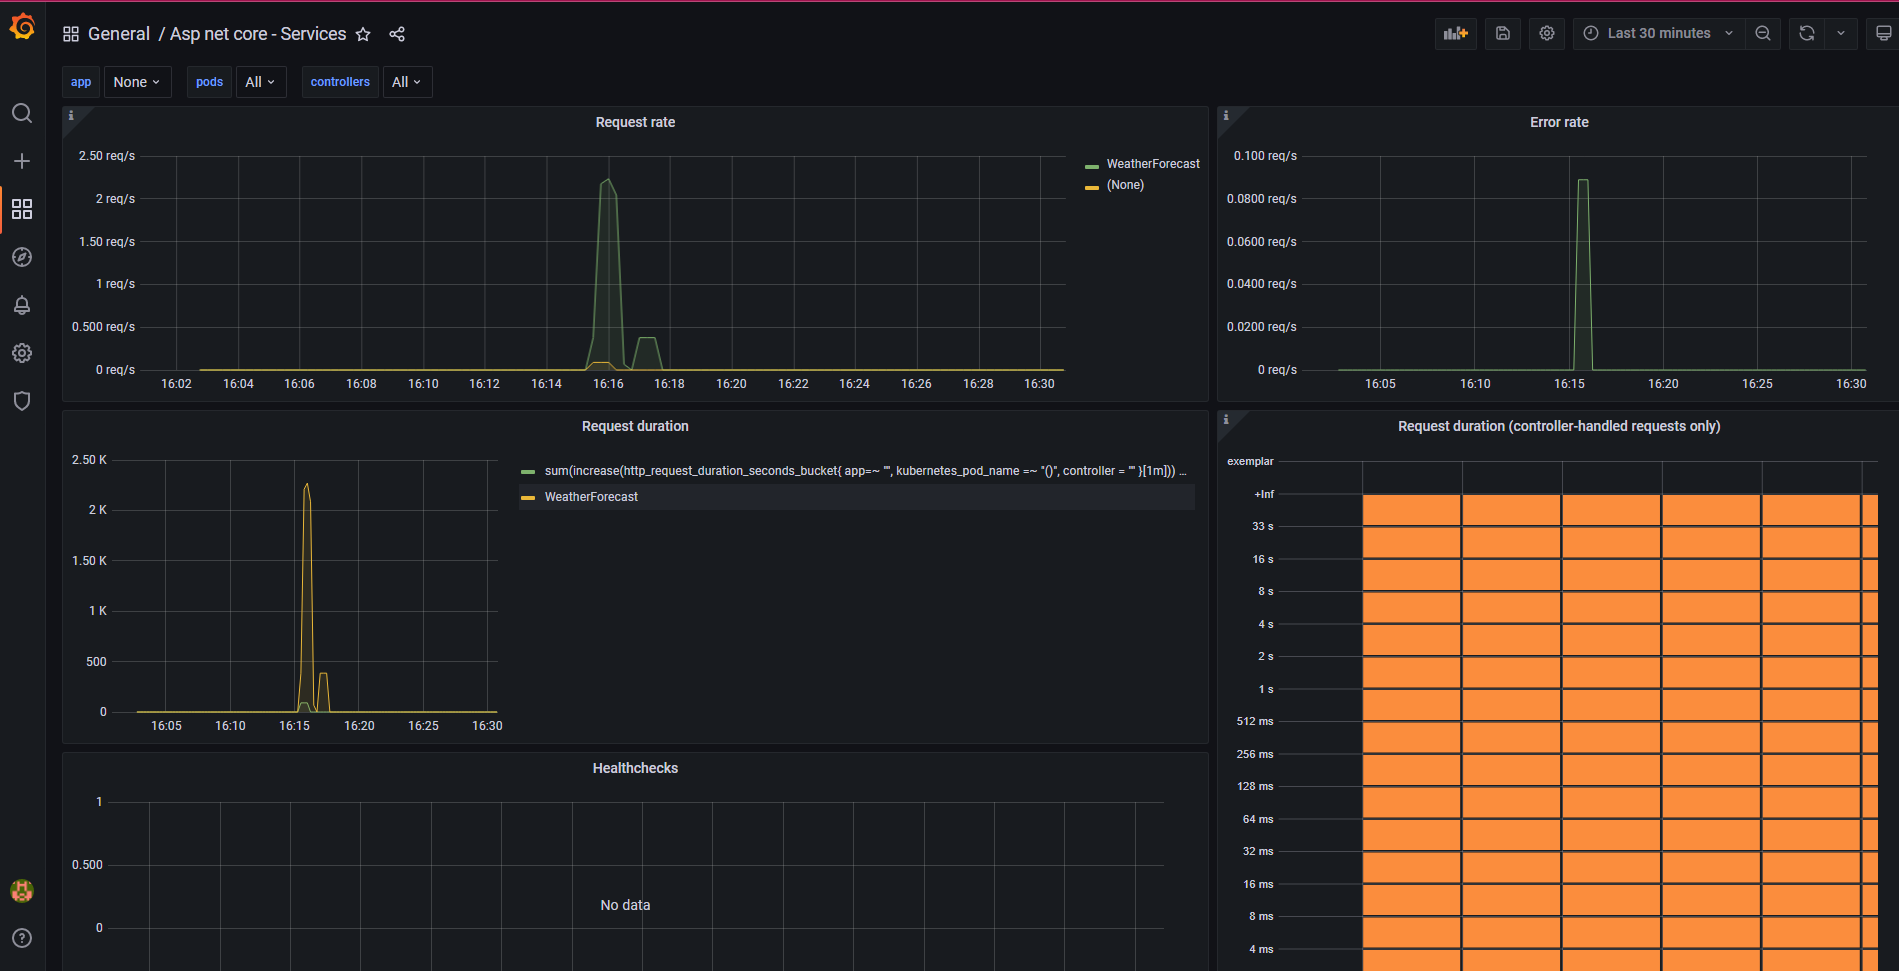
匯入 dashboard
Asp net core - Services
有些監控指標是來自k8s, 該dashboard 沒文件介紹,還不確定程式端是自定義 metrics 還是有套件可以使用
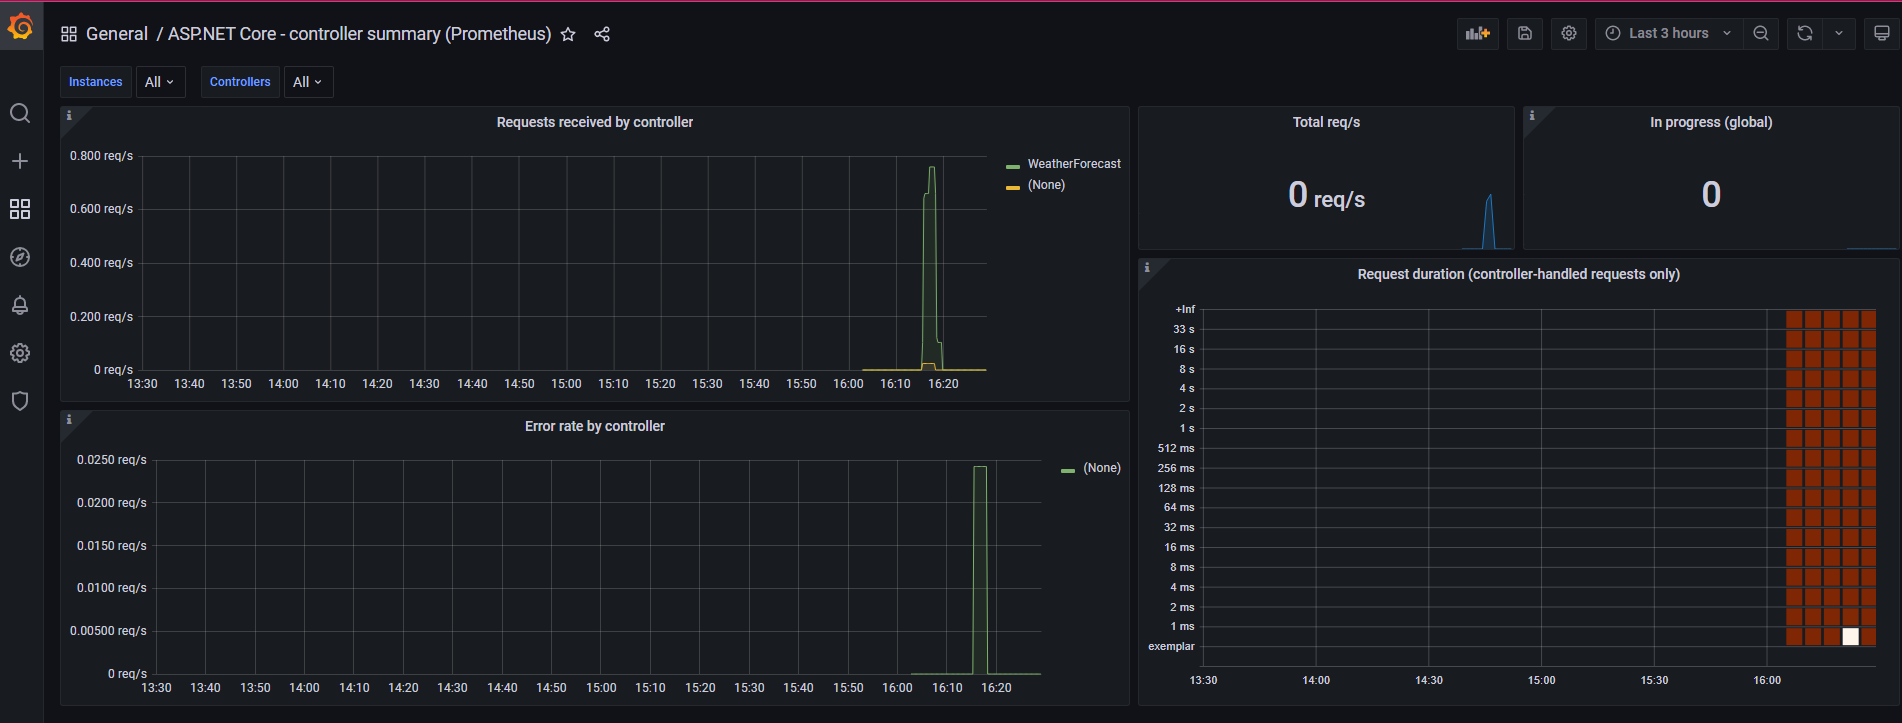
ASP.NET Core - controller summary (Prometheus)
http request
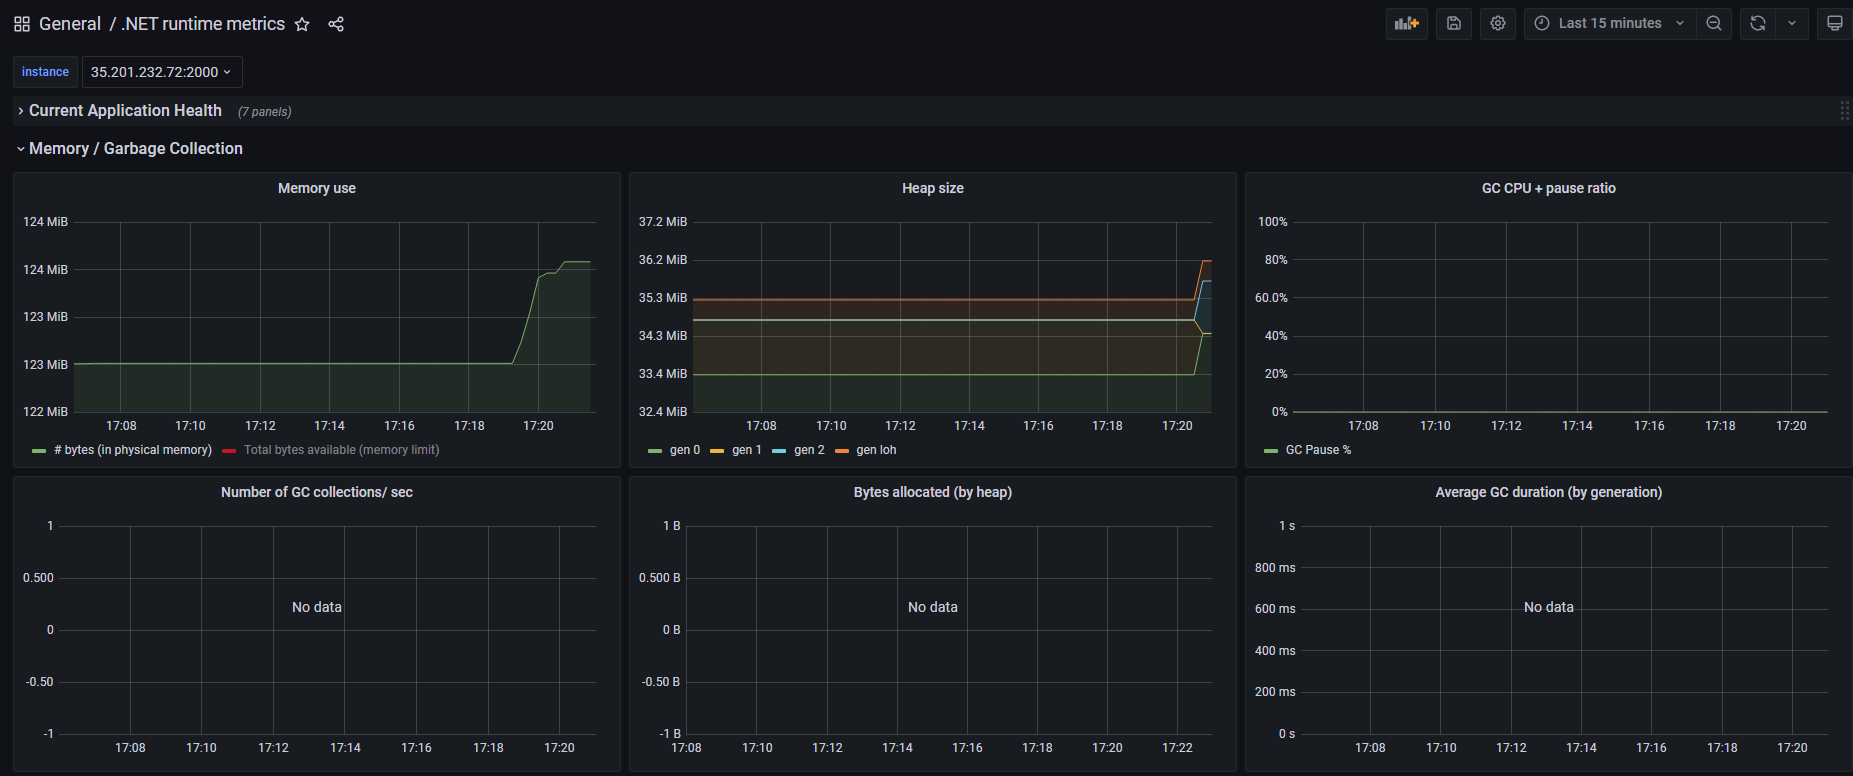
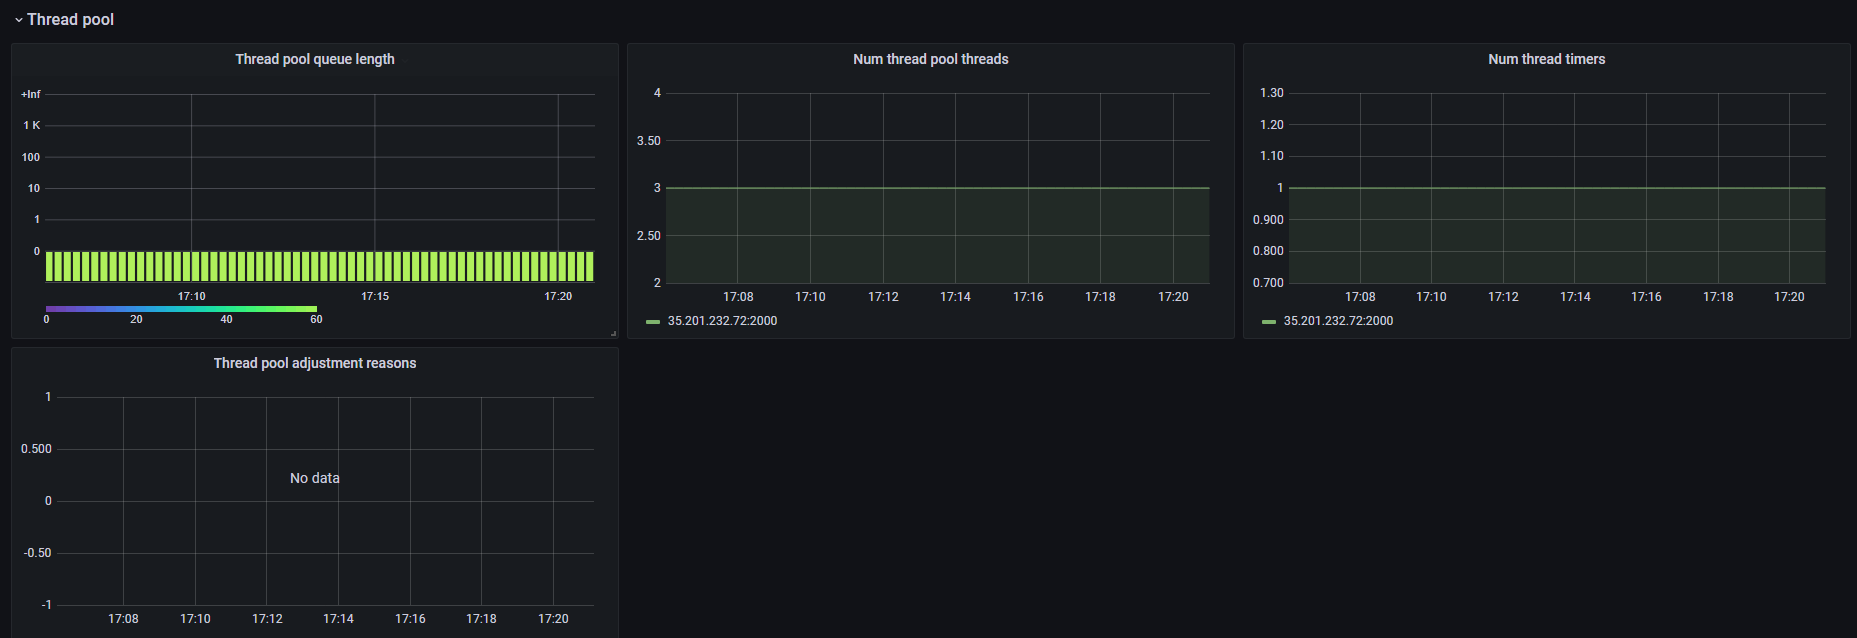
djluck/prometheus-net.DotNetRuntime - NET_runtime_metrics_dashboard.json
.Net runtime
有些圖表沒有正常顯示資料
還需要進一步研究 PromQL、Garfana dashboard 設定語法
參考文章
.Net Core服務監控報警指標上報Prometheus+Grafana
djluck/prometheus-net.DotNetRuntime
轉載請註明來源,若有任何錯誤或表達不清楚的地方,歡迎在下方評論區留言,也可以來信至 leozheng0621@gmail.com
如果文章對您有幫助,歡迎斗內(donate),請我喝杯咖啡

